- Initiatives
- Opportunities

Opportunities
Learn more about what opportunities mean at KHF, including for both funding and participation.

Current Opportunities
At any given time, we may have multiple available opportunities. This could include grants, sponsorships or when we seek your opinions.
- News & Views

News
See the latest news releases from KHF, including information on initiatives, opportunities and people.
Blog
Whether it's our staff or our board, the people associated with KHF have unique expertise and insights. Through this blog, you can read more about the topics that are important to us.

Stories
Want to know about the impact our partners are having across the state? Here, we try and share stories of impact and effort taking place each day.

Podcast
The Kansas Health Foundation published Leading Health in 2025. Today, this companion podcast will help break down key concepts in the book and introduce actionable ways we can work together to make a real impact on Health in Kansas.
- About Us
Who We Are
See a high-level overview of our work, our strategies, our team and our history.
Our Team
Learn more about the people that make KHF a place of both impact and enjoyment.

Financial Information
We try to always be effective stewards of the KHF endowment. Learn more about our finances and how they're managed.

Careers
Check here to see of any job postings and more information about working with us.


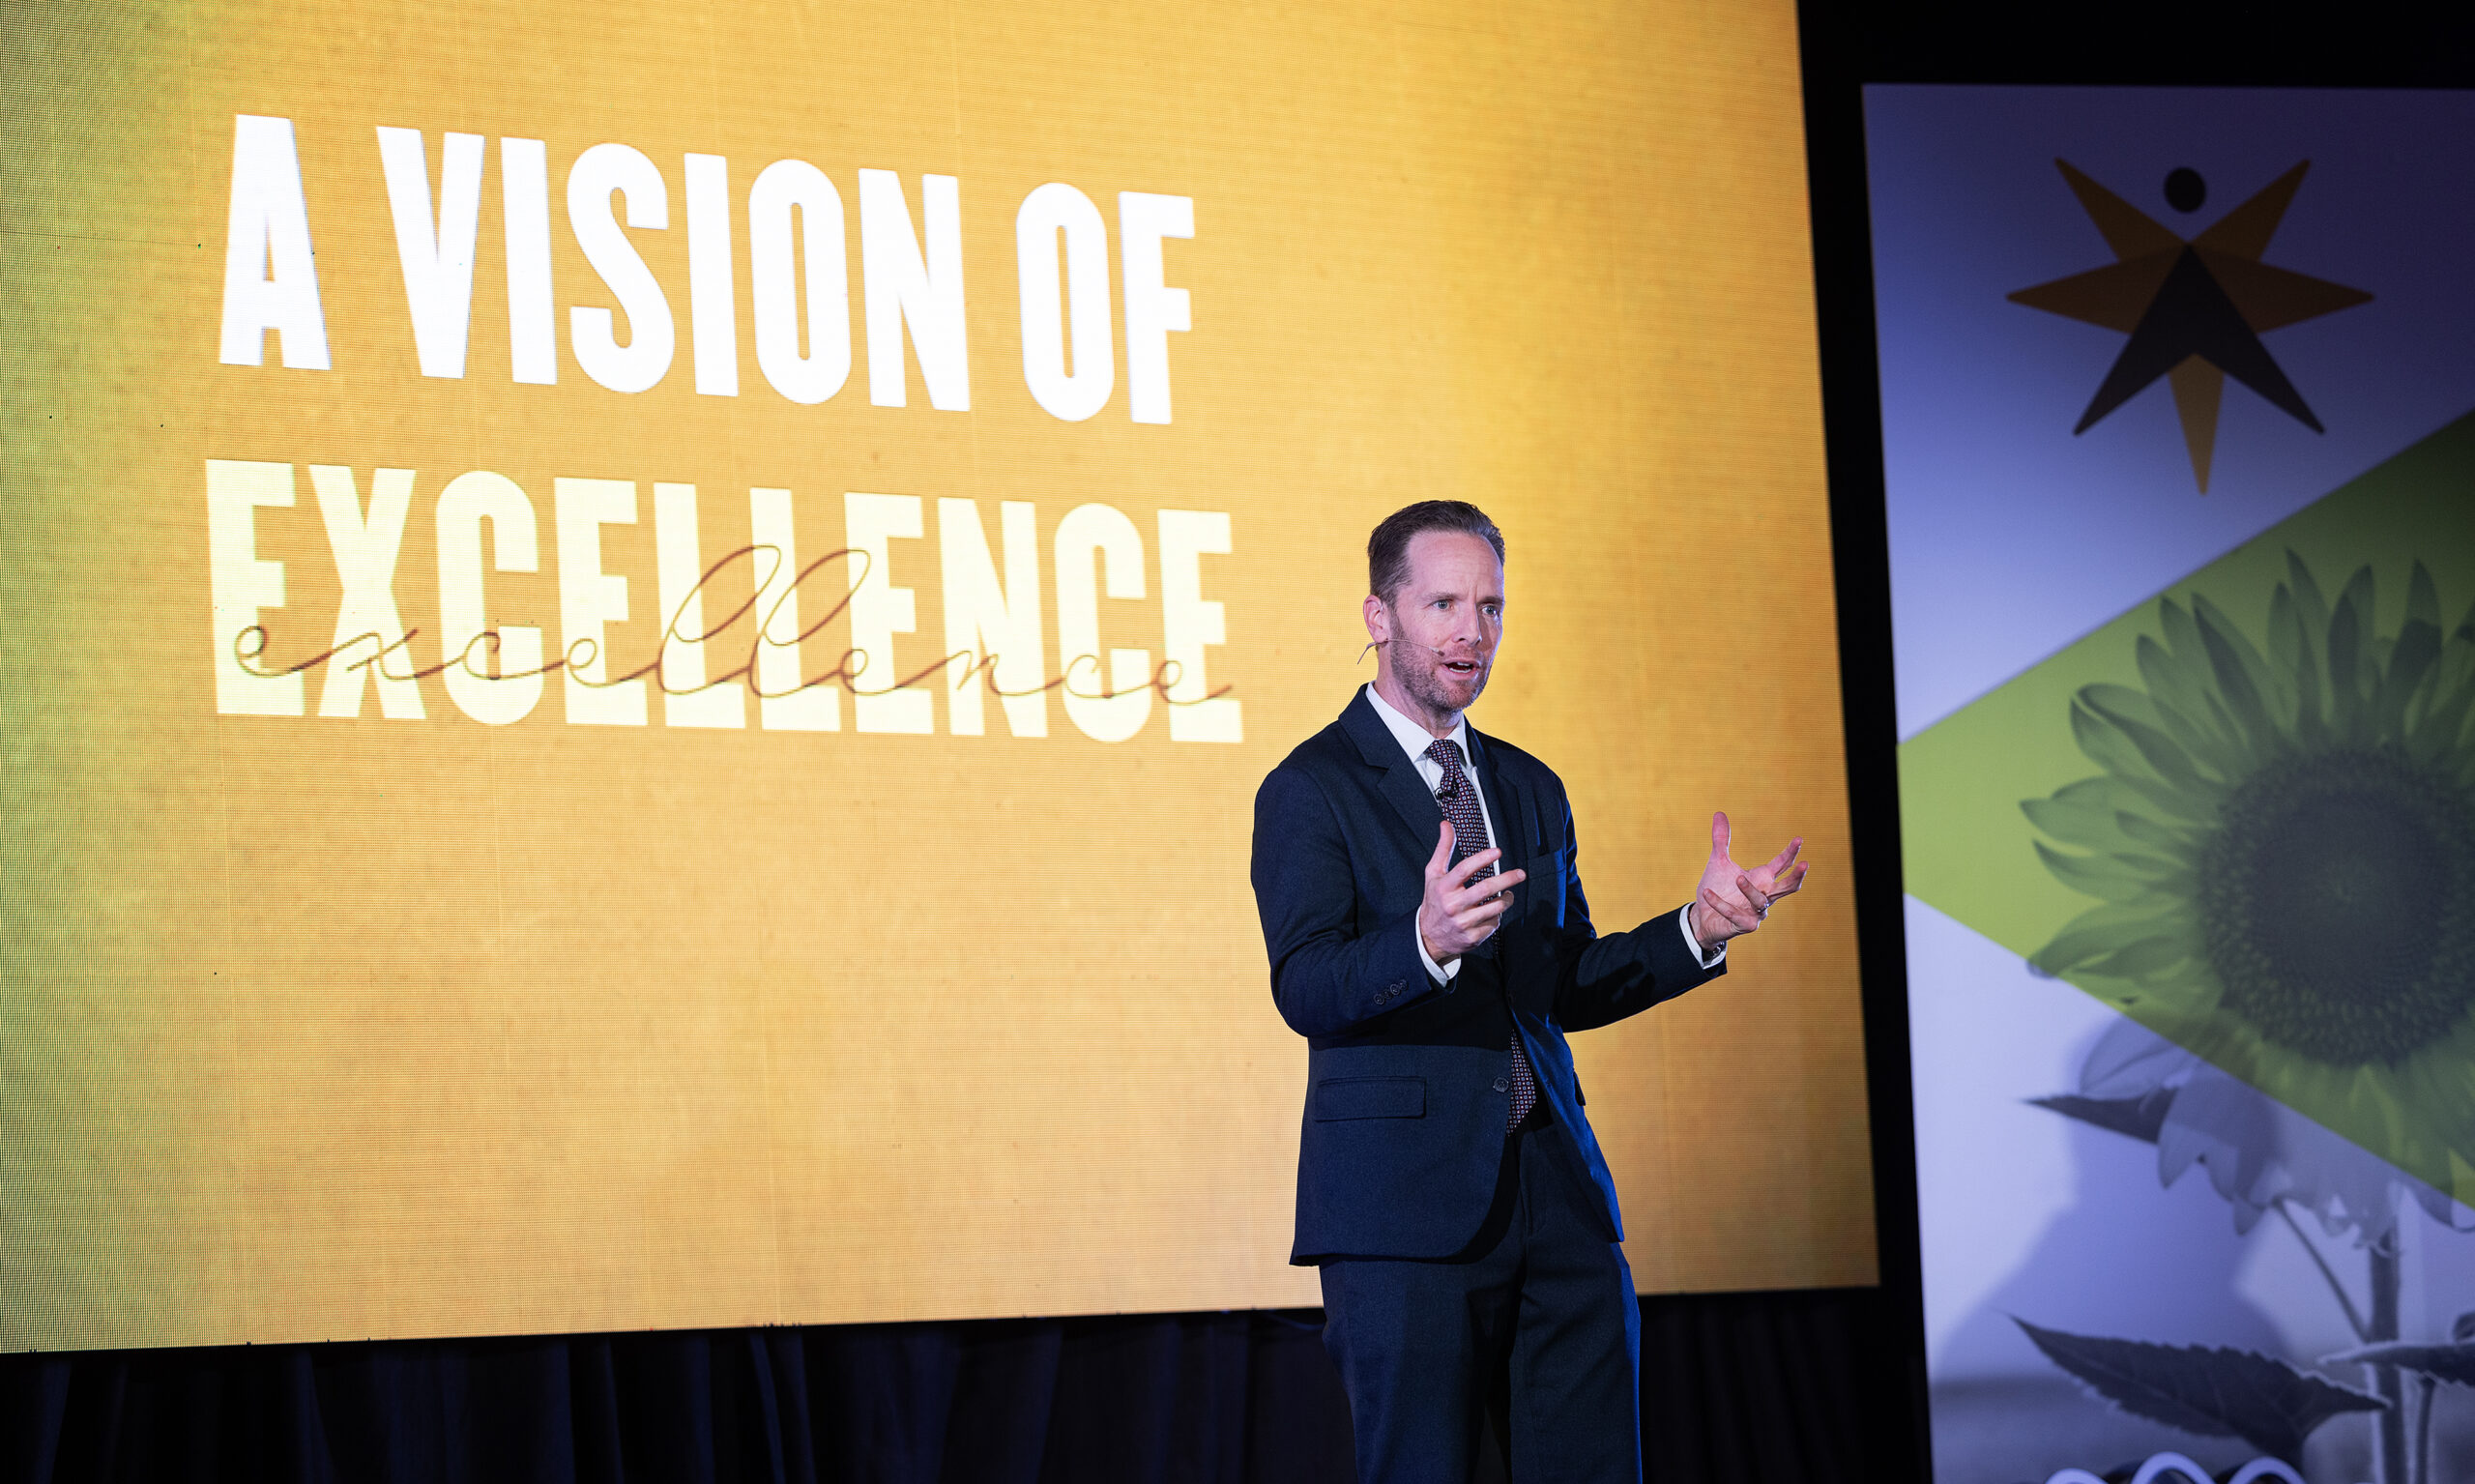
KHF Strategic Framework
Overview
Have you ever been on a road trip, but not had any directions? You can drive and drive, but if you don’t know where you’re going, who knows where you’ll end up!
The same can be true for organizations. At KHF, we needed to create a plan, a roadmap of sorts, for how we would approach our work. The result, which included many conversations with partners, our staff and our board, resulted in what we call our Strategic Framework.
The main components of this framework are our three-part purpose statement and our six key strategies. We also like to share our statement on change, which goes into detail about the different ways we believe change happens in communities and our state.
We invite you to view the information below to learn more about this framework, and how it guides the work we do around Kansas.
Three-Part Purpose
Every successful organization has to know its “Why.” Our “why” is demonstrated through our three-part purpose statement. These three statements serve as our overall goals and our greatest aspirations.
Six Key Strategies
If our three-part purpose statement represents our “why,” our six key strategies represent our “how.” We believe if we work effectively and make disciplined decisions to structure our work around these six strategies, we will see progress on the health of Kansans.


Strategy #2: Build the power and influence of partners working closest to the communities experiencing the greatest health disparities.

Strategy #3: Mobilize Kansans in authority roles to dismantle inequities that lead to health disparities.

KHF Statement on Change
We are changemakers. We fan the flames of change across Kansas, change that ushers in improved health and the ability for all Kansans to thrive. Here's what we believe helps make change happen in communities and in our state.